
More workers add capacity only while shared dependencies can absorb the work. After saturation, concurrency can increase queueing and service time.
Concurrency can increase service time
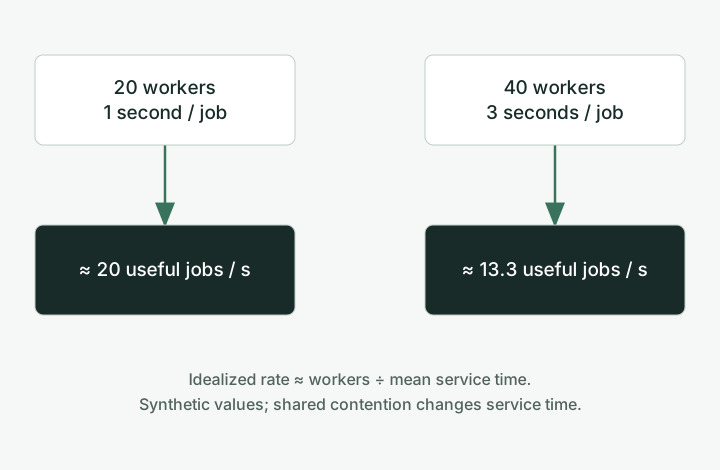
A synthetic example
At 20 workers and one second per job, the idealized rate is 20 jobs per second. At 40 workers and three seconds per job, it is about 13.3. These illustrative numbers omit utilization and workload variation.
Measure before scaling
Compare useful completions, oldest work age, retries, database waits, connection pool use, CPU, and memory over the same interval. Completed attempts are not always completed logical jobs.
A bounded experiment
Keep the input mix fixed, reduce concurrency in steps, and compare throughput and latency. Define an abort threshold for oldest work age. If dependency waits remain flat and CPU becomes the bottleneck, adding workers may become appropriate.
Practice this decision in the lab
Reproduce a contention hypothesis
This discrete-event simulation processes 2,000 identical jobs from a batch available at time zero. It measures simulated time, not the runtime speed of this computer. It uses Python’s heapq priority queue to process the next completion event.
The model deliberately assumes a dependency becomes more expensive above eight active jobs. At job start, service time is 100 + 2 × max(0, active jobs − 8)² milliseconds. That assumption creates the contention curve; the simulation does not discover a database bottleneck or establish that eight workers is a production recommendation.
git clone https://github.com/adroaldopagliari/backend-study-lab.git
cd backend-study-lab
python3 concurrency_experiment.py --output results/local.json
python3 -m unittest -vCompare the hypothesis with a control
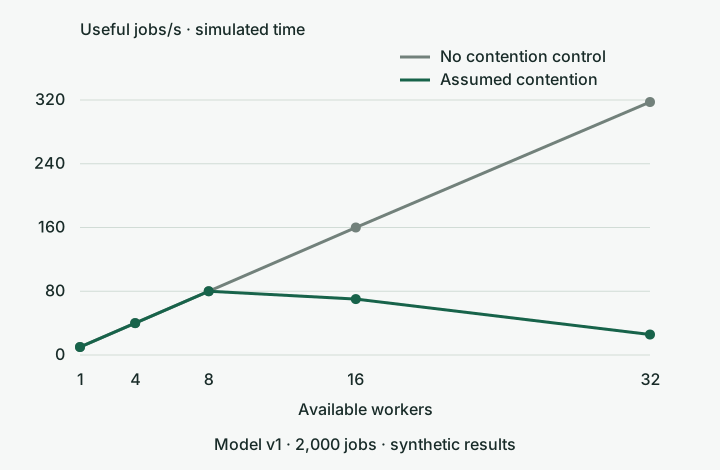
| Workers | Useful jobs/s | p95 service (ms) | Batch time (s) |
|---|---|---|---|
| 1 | 10.0 | 100.0 | 200.0 |
| 4 | 40.0 | 100.0 | 50.0 |
| 8 | 80.0 | 100.0 | 25.0 |
| 16 | 70.175 | 228.0 | 28.5 |
| 32 | 25.69 | 1252.0 | 77.852 |
With 32 workers but an in-flight limit of eight, the model returns 80 useful jobs/second and a 25-second batch time, matching the eight-worker run. This isolates active dependency work from the number of available workers. In the no-contention control, 32 workers reach about 317.46 jobs/second.
What the experiment can and cannot tell us
It demonstrates the consequences of an explicit hypothesis and provides a control that challenges a blanket “fewer workers is better” rule. It does not benchmark PostgreSQL, RabbitMQ, PDF rendering, cloud cost, or a production deployment. Service time is assigned at job start; there are no real threads, failures, retries, or workload variation. The p95 above excludes waiting before a job starts.
To test a real system, hold the workload mix and infrastructure fixed, define a warm-up and measurement window, repeat each concurrency level, and record useful completions, end-to-end latency, dependency waits, retries and oldest pending work. Predefine a rollback threshold. A falling completion rate with increasing dependency waits supports contention; a rising attempt rate with flat unique completions suggests retry amplification. Both require evidence beyond this model.
Download the recorded results and assumptions · Inspect the simulation source · See the related document-generation case
References and further reading
Primary sources for the technical concepts in this article. The examples and decisions above are my synthesis, not quotations from these sources.
- AWS Builders’ LibraryTimeouts, retries, and backoff with jitter
Retry load, bounded timeouts, and backoff.
- PostgreSQL documentationUsing EXPLAIN
Inspect estimates, actual work, and query plans.